Biovolume
Biovolume is commonly used as a size descriptor in the study of phytoplankton ecology. Morphological descriptors of phytoplankton, such as size and shape, are related to environmental variables of various kinds, and trait-based approaches are increasingly used in ecology to explain and predict phytoplankton community organization along environmental gradients. In addition, there is much experimental evidence showing the sensitivity of dimensional traits to environmental forcing factors and anthropogenic pressures as a function of ecosystem trophic state. Given that phytoplankton is considered in laws and directives as biological quality element in aquatic ecosystems to be use in monitoring plans for water quality assessment (e. g., Water Framework Directive, Environmental Protection Agency), reliable descriptors such as phytoplankton size can be useful in assessing ecosystem ecological status One of the starting points in the determination of morphological descriptors based on cell dimensions concerns the practical difficulty inherent in the measurement of linear dimensions. Cell biovolume has traditionally been calculated from microscopically measured linear dimensions and approximating cells to a geometric models.
Cell staining
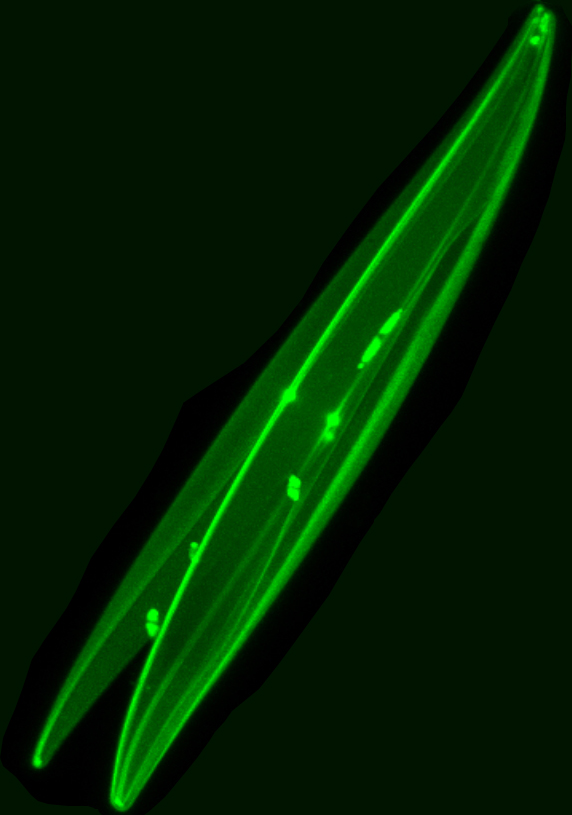
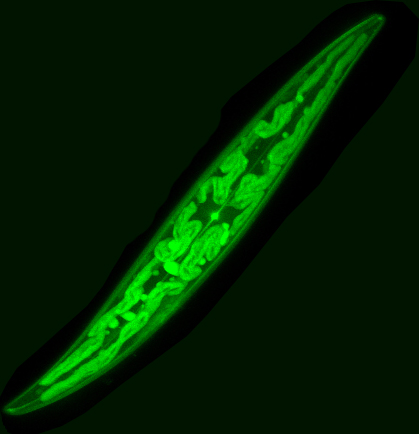
Diatoms – The cells were cultured in natural water supplemented with f/2 medium at a temperature of 22 °C and at day/night intervals of 16:8 h. Cultures of cells were supplemented with 1mM solutions of the dye LysoTracker Yellow HCK-123 to give final concentrations of 1, 0.5 and 0.25 µM. Diatoms co-precipitate dye with silica within the silica deposition vesicles, where new siliceous frustules are formed, making it possible to detect growing frustules by their fluorescence. Cells were then fixed with 4% formaldehyde for 1 hour at room temperature and frustule purification was performed. The subsamples were placed on a glass slide and covered with a glass coverslip.
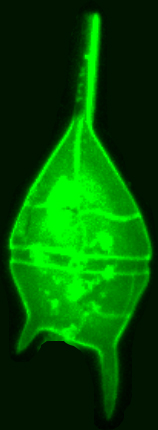
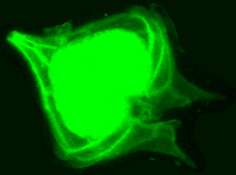
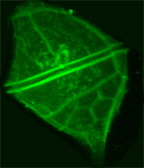
Dinoflagellates – Samples were fixed with 4% formaldehyde at for 1 h at room temperature. Then, samples were serially dehydrated for 5 min in each step of a 50%, 80%, 100% ethanol series and kept at 4°C in the dark until experiments were performed. Cells were stained with Calcofluor White at a final concentration of 10, 15 and 20 µg ml-1 and incubating 10 minutes in the dark at room temperature. Calcofluor stains cellulose specifically, the main component of the dinoflagellate theca. The subsamples were placed on a glass slide and covered with a coverslip.
Image acquisition and processing
Images were obtained using a confocal laser scanning microscopy system (Nikon C1 Confocal Microscope) equipped with an inverted microscope (Nikon TE300 ECLIPSE). The confocal microscope was equipped with two lasers, Ar ion and HeNe, supplying excitation wavelengths at 488 and 543 nm, respectively, to record optical sections. The confocal microscope was coupled to a Z-stage piezo-controller. The objective used was a 60X oil immersion plan APO. Acquired images were 3D reconstructed
with NIS – Elements AR Nikon Instruments software. They were processed with other software tools to visualize cell morphology in the xyz view and to measure linear dimensions on the xyz axes . NIS software was used to calculate the number of voxels enclosed by the shape boundary, defined by the exact xyz dimensions of each 3D image providing the direct cell biovolume.
