The ISS-Phyto represents a new size spectra sensitivity-based approach to ecological status assessment in transitional waters (ISS-Phyto). This index integrates simple size structure metrics with phytoplankton biomass, taxonomic richness thresholds and models of phytoplankton size class sensitivity to anthropogenic disturbance.
The ISS-phyto is calculated using the following formula:
ISS-phyto = Σ p (CLi) * ωi * si * bi
where CLi = ith size class; ωi = sensitivity value assigned to the ith size class, i = descriptor of size classes, from class 1 to 6; si = correction factor on number of different species found; bi = correction factor on chl a value.
The elaboration goes on three main steps:
FIRST STEP – UPLOAD: you have to upload your dataset, that have to be in .xls or .xlsx format and have to contain the columns as shown in the figure below (included data are only an example). Attention: the name of the Data Sheet inside the Excel file has to be ISS_Data.
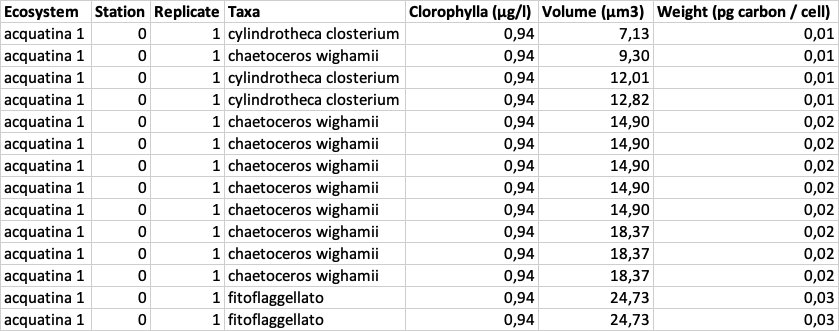
On this step you have also to choose if you want to take directly the weight data from the Excel or weight has to be calculated from volume by checking the corresponding choose (Weight or Volume).
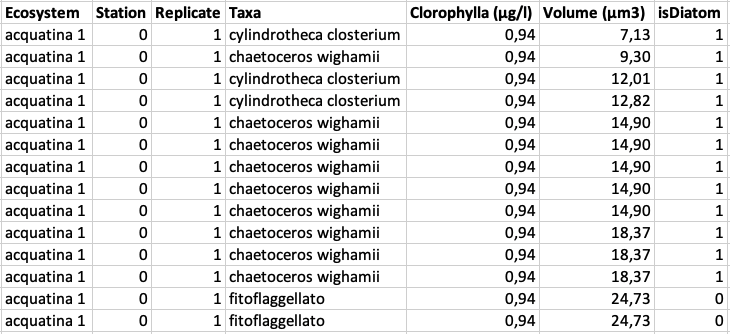
If you check “Volume”, you have to add a binary (0, 1) data column, called isDiatom, on the right, that indicate if taxa is Diatom or not.
SECOND STEP – TEST: in this step, after clicking on ‘FORMAT’ button, data previously uploaded are validated to check the data type of each input field. At the end the total number of stations and the total number of species are shown. If some replicates have less than 20 items, you will see a specific warning message, because in this case the ISS value result could be affected by error.
THIRD STEP – ACQUISITION: clicking on ‘RUN’ button, you can start the data elaboration to calculate the ISS value and the size class distribution for each Station. At the end you can view the results in table format by clicking on ‘ISS’ button. For each replicate are shown the six size classes with the contribute to ISS. The sum of the six values is the ISS value, shown on ISS column. The ecological quality status is a standard evaluation that depends on ISS value.
If you select a specific row of the grid, you can view detailed information on Replicate or Station, Ecosystem or a group of Replicates inside the Station selected, respectively clicking on the correspondent button of the selected row. As in the example below, you can view detailed information on the selected replicate, such as the total population, the size class distribution (number of individuals for each size class), the number of different taxa found into the station and the number of individuals for each taxa (in the scrolling list on the right).